
Understanding Sustained Attention Rate (SAR)
Overview
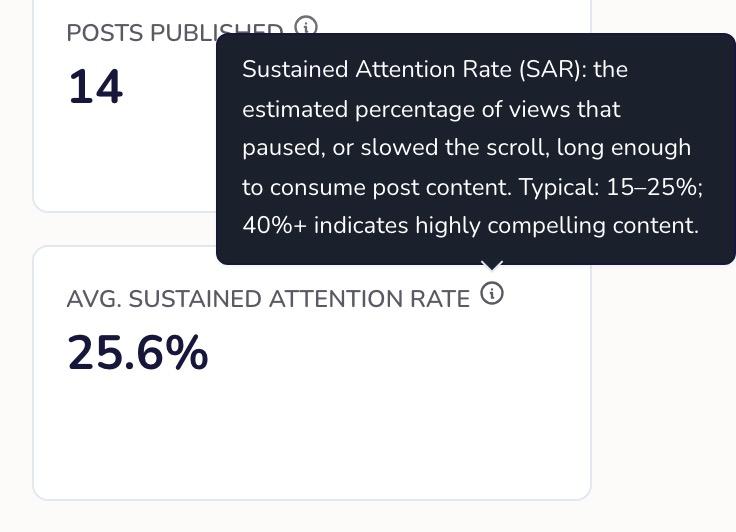
Sustained Attention Rate (SAR) is the estimated percentage of views that paused, or slowed the scroll, long enough to take in your post. It tells you whether people stopped for your content, whether or not they liked or commented.
For example, a SAR of 20% means that about 1 in 5 views paused long enough to take in the post.
SAR is a strong signal of content quality. A post with modest reach but a high SAR is holding attention; a post with high reach but a low SAR is being scrolled past.
How SAR Is Calculated
SAR is an estimate. How we estimate it depends on the platform and the type of post:
- Facebook videos: 3-second views divided by total views.
- Instagram and TikTok videos: video views divided by reach.
- YouTube videos: YouTube's average percentage of the video watched.
- Photos and other non-video posts: an estimate built from the post's engagement and view signals, calibrated to your account.
A post's SAR is never lower than its engagement rate, because everyone who engaged also paused.
Your period SAR (the number on the Analytics cards) is the average of each post's SAR in the selected period.
SAR is available for Facebook, Instagram, TikTok and YouTube posts. It can be blank for a new post, or for a TikTok post when TikTok doesn't report reach.
Where to Find SAR
- Click Analytics in the left sidebar.
- In the Overview section, the Sustained Attention Rate card shows your average for the selected period. On Pro, Premier and Enterprise plans it also shows how you compare with the industry median. Until there is enough data, the card reads Collecting data.
- In the Insights section (Pro, Premier and Enterprise), the Strategic Scatter Plot plots every post. Click Sustained Attention Rate above the chart to switch it to Reach vs Sustained Attention Rate.
- In the Content Performance list, the SAR column shows each post's rate. Click a post to see its detail view.
The Overview page also shows your period SAR in its analytics snapshot.
What Is a Good SAR?
| SAR | What it means |
|---|---|
| Below about 10% | The post is mostly being scrolled past. Try a stronger opening or a more relevant topic. |
| 15%–25% | Typical for practice content. |
| 40% and above | Highly compelling content. Study these posts and make more like them. |
These are the same ranges shown in the SAR tooltip and in your PDF reports.
Tips for Improving SAR
- Lead with value. The first line, or the first three seconds of a video, should promise something specific.
- Write for your audience. Content that matches what your patients and community care about holds attention longer.
- Use stories. Practice stories and de-identified patient journeys keep people reading.
- Ask a question. People pause to read and think about a good question.
FAQ
Q: Why is my SAR higher than my engagement rate?
A: Many more people pause on a post than like or comment on it. SAR counts the pause; engagement rate counts the action.
Q: Why is SAR blank for some posts?
A: New posts need time for stats to arrive. TikTok posts show no SAR when TikTok doesn't report reach for them.